
Sixty minutes for two tasks that are weighted very differently. Below are real Task 1 charts and Task 2 essay prompts, each with a band 8 model answer you can read for structure rather than copy for phrases.
You get roughly 20 minutes and a 150-word minimum to report what a chart, table or diagram shows. The examiner is not looking for opinions or reasons here — only for an accurate overview and the comparisons that matter. Writing under 150 words costs you marks automatically, so the safe target is 170–190.
Summarise the information by selecting and reporting the main features, and make comparisons where relevant.
Band 8 model answer
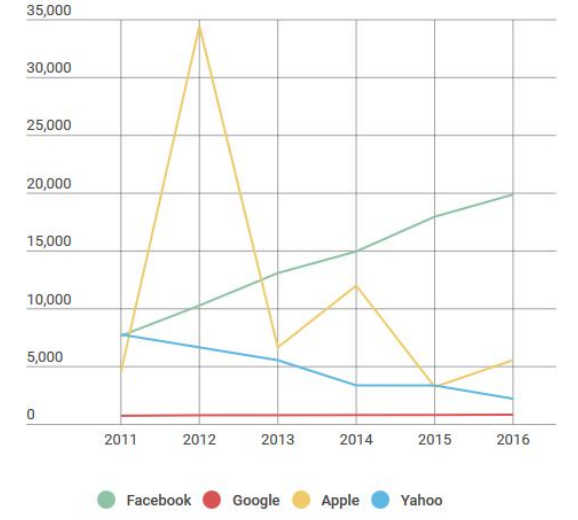
The line graph displays the stock values of four different high-tech corporations from 2011 to 2016. Overall, Facebook’s value steadily increased, while Yahoo’s decreased. Apple’s stock price fluctuated wildly throughout the period and Google’s stayed relatively unchanged. Facebook started the period with a stock market valuation of approximately 7,500 and this consistently moved up in value year on year to reach a peak of around 20,000 in 2016. Yahoo began the recorded period with a very similarvalue to Facebook, but in contrast, its stock devalued every year, until itreached a low of about 2,500 in 2016.Apple stock was valued at just below 5,000 in 2011 and this jumpeddramatically to nearly 35,000 the following year, before plummeting toaround 7,000 in 2013. It recovered slightly in 2014 to around 12,000 andsubsequently fell to a price of just over 5,000 in 2016. Google’s sharesremained at around 1,000 for the entire period.
Summarise the information by selecting and reporting the main features, and make comparisons where relevant.
Band 8 model answer
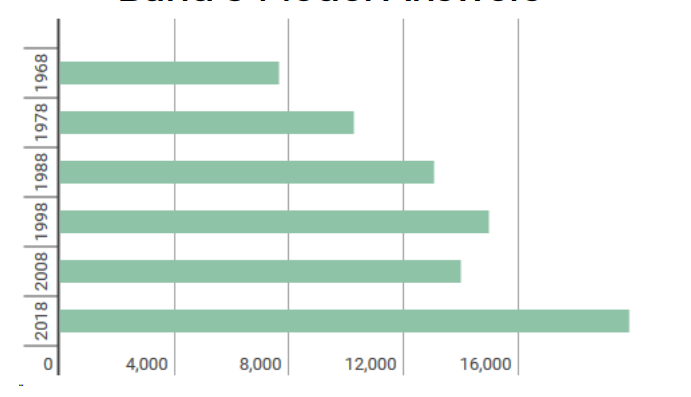
The bar chart displays the average salary in the Republic of Ireland in 5different years with an estimated value for 2018. The unit of currency is inUnited States dollars.Overall, it can be clearly seen that wages consistently increased in everyrecorded time period, except 2008, when they decreased slightly. Salaries areexpected to increase significantly in the future.Average earnings in 1968 stood at their lowest recorded levels at just under$8,000 and they then increased a decade later to around $10,000 in 1978. Thistrend continued in 1988 with the average income climbing to approximately$13,000. 10 years later, in 1998, it further improved to its highest recorded valueof about $15,000.The only notable exception to this expansion in levels of pay was 2008 whenwages decreased by around $1,000 from the peak of 1998. However, this trendis not expected to continue in the future with projections of over $20,000forecast for 2018.
Summarise the information by selecting and reporting the main features, and make comparisons where relevant.
Band 8 model answer
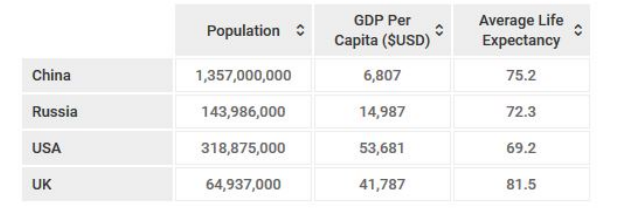
The table provides key information about the population, gross domesticproduct per person and life expectancy in four different countries.Overall, there are two very noticeable features. Firstly, China has by far thehighest number of citizens, but they have the lowest economic output perperson out of the four powers. Secondly, the United States has the highestearnings, but the lowest life expectancy.China has the highest number of people with around 1.3 billion citizens,however, the average person only produces $6,807 and the Chinese averageage upon death is 75.2 years. This is in contrast with the USA where peopleearn, on average, nearly 10 times more than a normal man or woman fromChina. Despite this, Americans live significantly shorter lives at just 69.2 years.The United Kingdom has the lowest population of the four countries with justunder 65 million, but notably has the second highest GDP and the highest lifeexpectancy with $41,787 and 81.5 years respectively. Russia has a population ofnearly 144 million and a relatively low GDP per capita of nearly $15,000.
Task 2 carries twice the weight of Task 1, so it deserves the larger share of the hour — about 40 minutes and at least 250 words. The single most common reason a strong writer scores 6.5 instead of 7.5 is answering only part of the question, so spend the first two minutes deciding exactly what you are being asked to do.
In cities and towns all over the world the high volume of traffic is a problem. What are the causes of this and what actions can be taken to solve this problem?
Band 8 model answer
It is undoubtedly the case that urban areas around the world increasingly suffer from congestion. In this essay, I examine the reasons for this trend and suggest some practical policies the authorities could implement to reduce the level of traffic in our cities. The first step is to understand why traffic has increased in towns and cities. Broadly speaking, there are three main reasons for this. One is that cars have become more affordable for the average consumer and they are no longer a luxury item, but something that most families expect to own. A second reason is that public transport has become increasingly unreliable in recent years, not least because many bus and train services have been reduced because of the difficulty in funding them. The third reason is that society has in general become more mobile and this means more people are prepared to commute to work by car than they were before. There is almost certainly no one solution to this problem given the complexity of its causes. However, one option has to be to improve the reliability of public transport to encourage people to take the bus or the train rather than get in the car. It would also be possible to discourage people from driving to work by introducing special tariffs for using the roads, especially during peak periods. A successful example of this is the congestion charge scheme in London which has certainly reduced the level of trafficin inner-city areas. In conclusion, there are a variety of different factors that have led to rising levels of traffic in urban areas. While it may not be possible to find a complete solution, any action should probably involve encouraging greater use of public transport and making it more expensive for the motorist to drive in urban areas.
Some people think that the teenage years are the happiest times of most people's lives. Others think that adult life brings more happiness, in spite of greater responsibilities. Discuss both views and give your own opinion.
Band 8 model answer
What's the happiest time in people's lives: youth or old age; school, career or retirement? All of these have been suggested, but teenage years and adulthood both have many supporters. Those who believe teenagers are the happiest people cite their lack of responsibilities as a significant factor. They are supported financially and emotionally by their parents, and although they may be included in family decisions, they're not ultimately responsible. However, adolescents are on the threshold of adult life: they're old enough to get a part-time job, so they can enjoy their first taste of financial independence, and their future study and career lie ahead. Away from these serious concerns, young people have an active social life with their friends, often simply by hanging out with them. And of course, there’s the excitement of first love and first heartbreak. With all this to experience, teenagers see their parents' lives as boring and stressful. However, the reverse is also true. Adults see anxious, self-dramatising adolescents, and appreciate the joys of maturity. These may include a contented family life, long-lasting friendships and a career. Long-term relationships may not have the fireworks of adolescence, but are stronger for it, because of the wealth of shared experience. At work, many of us are challenged and stimulated by the increasing, professional skills we acquire, which ensures that our jobs remain interesting. The greatest benefit, though, is that maturity gives you greater confidence in your own judgement, in all areas of life. You’re not afraid to express your opinion when others disagree and, unlike a teenager, you know when to let things go. Both these periods can be happy times, but I look back at my own teenage years, with no desire to go back. Adult life may be less dramatic, but fireworks don’t keep you warm
Many feel that the common educational system of teachers and students in a classroom will be replaced by the year 2050. Do you agree with this view? Give your opinion.

Written by Kirill O'Nayd
IELTS expert and educator at TestSucceed, with over a decade of experience preparing candidates for the Academic and General Training modules. Author of the Complete IELTS Preparation Course on Udemy ★★★★★★4.7