
IELTS · ПИСЬМО: ПРИМЕРЫ
Практика IELTS Writing: задания и образцы ответов
Шестьдесят минут на два задания, которые весят совсем по-разному. Ниже — настоящие графики для Task 1 и темы эссе для Task 2, и к каждому заданию есть образец ответа на band 8: читайте его ради структуры, а не ради готовых фраз.
Task 1 – описание графиков и данных
20 мин · 150 словУ вас есть примерно 20 минут и минимум 150 слов, чтобы описать, что показывает график, таблица или схема. Мнения и причины экзаменатора здесь не интересуют — только точный обзор и те сравнения, которые действительно важны. За текст короче 150 слов балл снижается автоматически, поэтому безопасный ориентир — 170–200 слов. Если на рисунке пять категорий, нужна верхняя граница этого диапазона, и именно поэтому образцы ответов ниже чуть длиннее.
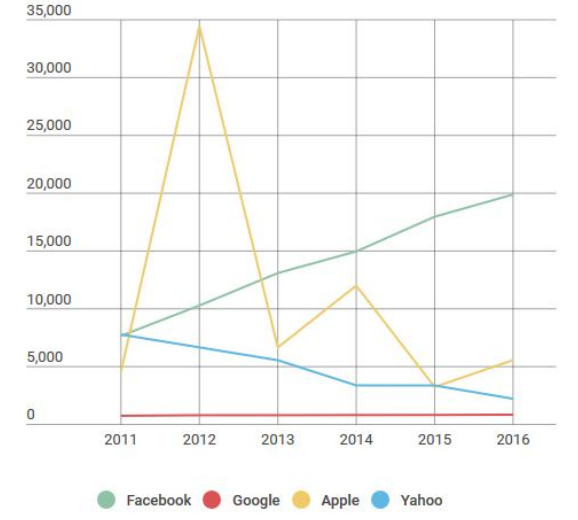
Разбор Task 1Обзор, ключевые особенности и сравненияTask 1, вопрос 1: The graph above shows the stock price of four technology companies between 2011 and 2016.
Summarise the information by selecting and reporting the main features, and make comparisons where relevant.
Показать образец на band 8
Band 8 model answer — 148 words
The line graph displays the stock values of four different high-tech corporations from 2011 to 2016. Overall, Facebook’s value steadily increased, while Yahoo’s decreased. Apple’s stock price fluctuated wildly throughout the period and Google’s stayed relatively unchanged. Facebook started the period with a stock market valuation of approximately 7,500 and this consistently moved up in value year on year to reach a peak of around 20,000 in 2016. Yahoo began the recorded period with a very similarvalue to Facebook, but in contrast, its stock devalued every year, until itreached a low of about 2,500 in 2016.Apple stock was valued at just below 5,000 in 2011 and this jumpeddramatically to nearly 35,000 the following year, before plummeting toaround 7,000 in 2013. It recovered slightly in 2014 to around 12,000 andsubsequently fell to a price of just over 5,000 in 2016. Google’s sharesremained at around 1,000 for the entire period.
Обратите внимание: этот ответ короче минимального объёма для задания, и в таком виде он потерял бы баллы. Смотрите на структуру, а не на длину.
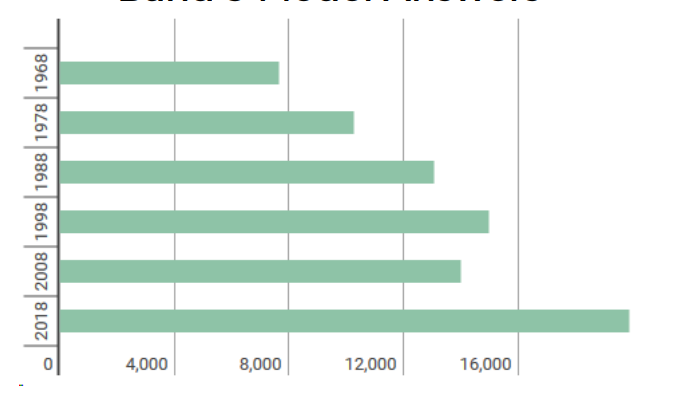
Task 1, вопрос 2: The bar graph above shows average earnings in the Republic of Ireland in 5 different years, with projections for the future. Earnings are in US dollars ($).
Summarise the information by selecting and reporting the main features, and make comparisons where relevant.
Показать образец на band 8
Band 8 model answer — 145 words
The bar chart displays the average salary in the Republic of Ireland in 5different years with an estimated value for 2018. The unit of currency is inUnited States dollars.Overall, it can be clearly seen that wages consistently increased in everyrecorded time period, except 2008, when they decreased slightly. Salaries areexpected to increase significantly in the future.Average earnings in 1968 stood at their lowest recorded levels at just under$8,000 and they then increased a decade later to around $10,000 in 1978. Thistrend continued in 1988 with the average income climbing to approximately$13,000. 10 years later, in 1998, it further improved to its highest recorded valueof about $15,000.The only notable exception to this expansion in levels of pay was 2008 whenwages decreased by around $1,000 from the peak of 1998. However, this trendis not expected to continue in the future with projections of over $20,000forecast for 2018.
Обратите внимание: этот ответ короче минимального объёма для задания, и в таком виде он потерял бы баллы. Смотрите на структуру, а не на длину.
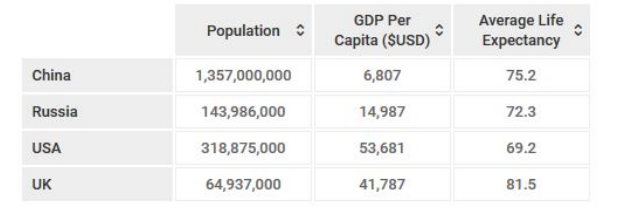
Task 1, вопрос 3: The table above shows data on the demographics of four nations.
Summarise the information by selecting and reporting the main features, and make comparisons where relevant.
Показать образец на band 8
Band 8 model answer — 166 words
The table provides key information about the population, gross domesticproduct per person and life expectancy in four different countries.Overall, there are two very noticeable features. Firstly, China has by far thehighest number of citizens, but they have the lowest economic output perperson out of the four powers. Secondly, the United States has the highestearnings, but the lowest life expectancy.China has the highest number of people with around 1.3 billion citizens,however, the average person only produces $6,807 and the Chinese averageage upon death is 75.2 years. This is in contrast with the USA where peopleearn, on average, nearly 10 times more than a normal man or woman fromChina. Despite this, Americans live significantly shorter lives at just 69.2 years.The United Kingdom has the lowest population of the four countries with justunder 65 million, but notably has the second highest GDP and the highest lifeexpectancy with $41,787 and 81.5 years respectively. Russia has a population ofnearly 144 million and a relatively low GDP per capita of nearly $15,000.
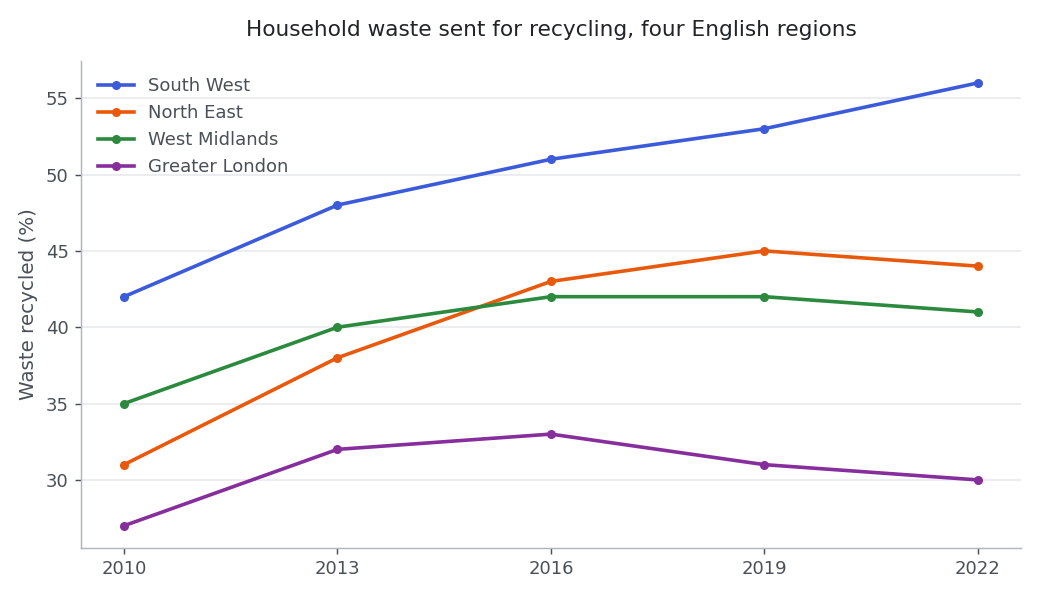
Task 1, вопрос 4: The line graph below shows the percentage of household waste that was recycled in four regions of England between 2010 and 2022.
Summarise the information by selecting and reporting the main features, and make comparisons where relevant.
Показать образец на band 6
Band 6 model answer — 220 words
The line graph gives information about the percentage of household waste which was recycled in four regions of England from 2010 to 2022.
Overall, we can see that the recycling rate increased in all four regions, but the South West had always the highest percentage and Greater London had the lowest one.
Firstly, in 2010 the South West recycled 42 per cent of its waste and this number grew in every period until it arrived at 56 per cent in 2022. It was the only region which improve all the time. Secondly, the North East started at 31 per cent, which was quite low, and then it rose quickly to 45 per cent in 2019. After that it decreased a little bit to 44 per cent in the last year of the graph.
Thirdly, the West Midlands went up from 35 per cent to 42 per cent in 2016 and stayed the same in 2019, and then it fall to 41 per cent in 2022. Finally, Greater London was the lowest region in all the years. It increased to 33 per cent in 2016, but after that it went down to 30 per cent, so the difference with the South West became much bigger than before.
In conclusion, recycling became better in these four regions, especially in the South West.
Why this is band 6: Task Achievement is adequate — the key figures are selected and the overview is there — but development is mechanical, with each region simply listed behind 'Firstly', 'Secondly', 'Thirdly' and no real comparison. Grammatical errors ('had always the highest', 'which improve', 'it fall') are noticeable in almost every paragraph without obscuring the meaning, which holds this at 6.
Показать образец на band 7
Band 7 model answer — 213 words
The line graph compares the proportion of household waste that was recycled in four English regions at three-yearly intervals between 2010 and 2022.
Overall, recycling rates improved in every region, but the gap between the best and worst performers widened considerably. The South West led throughout and was the only region still rising at the end of the period, whereas Greater London stayed in last place and lost ground after 2016.
In 2010 the South West already recycled 42% of household waste, well ahead of the West Midlands on 35%, the North East on 31% and London on 27%. Over the following twelve years the South West climbed steadily to 56%, which represent a gain of 14 percentage points, so its lead over London grew from 15 points to 26.
Despite starting from the second lowest position, the North East made the sharpest early progress, rising to 45% by 2019 before slipping back marginally to 44%. The West Midlands followed a similar but flatter path, reaching 42% in 2016 and then levelling off, with a small fall to 41% in the final year. London's figures were the weakest at every reading: having peaked at a modest 33% in 2016, the capital's rate declined to 30%, barely three points above where it had begun.
Why this is band 7: A clear overview and a logical progression from the strongest to the weakest region, with accurate data selection and some less common phrasing ('levelling off', 'at every reading'). The remaining errors sit inside complex structures ('which represent a gain'), which keeps it below band 8.
Показать образец на band 8
Band 8 model answer — 230 words
The line graph charts the share of household waste sent for recycling in four English regions at three-yearly intervals from 2010 to 2022.
Although every region recycled more at the end of the period than at the start, the striking feature is divergence rather than shared progress: the South West pulled steadily away from the rest, while the other three stalled or slipped back after 2016.
The South West began from the strongest position, at 42%, and was the only region to improve at every reading, reaching 56% by 2022. Its advantage over Greater London, the weakest performer throughout, consequently widened from 15 percentage points to 26.
Progress elsewhere was front-loaded. The North East made the most striking gains in the first decade, climbing from 31% in 2010 — then the second lowest figure — to 45% in 2019, before easing back by a single point. The West Midlands traced a flatter version of the same curve, adding seven points to reach 42% in 2016 and then plateauing, with a marginal decline to 41% in the final year.
London's trajectory is the one genuine exception to the upward trend. Its rate crept up to a peak of just 33% in 2016, a level the South West had already passed before the graph begins, and then fell away to 30%, leaving the capital only three points better off after twelve years.
Why this is band 8: Fully developed: the overview identifies divergence rather than listing four separate trends, and the paragraphing groups the regions by behaviour rather than by name. Lexis is precise and flexible ('front-loaded', 'plateauing', 'eased back by a single point') and the grammar is error-free across a wide range of structures.
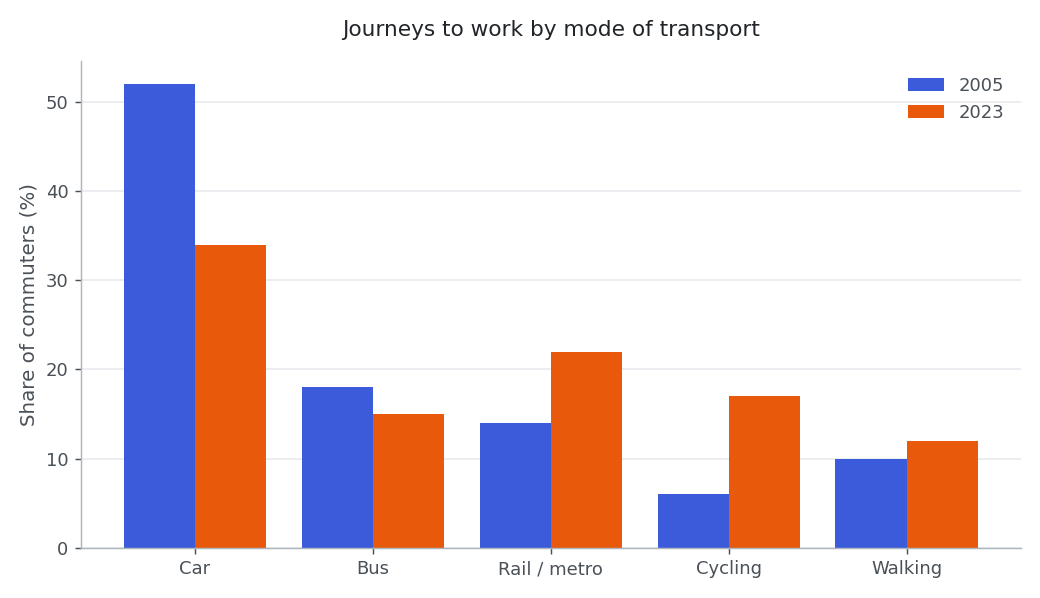
Task 1, вопрос 5: The chart below shows how commuters in one European city travelled to work in 2005 and in 2023.
Summarise the information by selecting and reporting the main features, and make comparisons where relevant.
Показать образец на band 6
Band 6 model answer — 232 words
The bar chart shows the way how commuters in one European city went to their work in 2005 and in 2023. There are five types of transport and the numbers are given in percentages.
Overall, the car was the most popular transport in the both years, but it became much less popular, and cycling and rail/metro were used more in 2023.
Firstly, in 2005 more than a half of the commuters used a car, exactly 52 per cent. In 2023 this number dropped to 34 per cent, which is a big fall of 18 per cent. Even so, the car was still the first choice of the people in this city.
Secondly, cycling was only 6 per cent in 2005 and this is the smallest number in the chart. But in 2023 it increased to 17 per cent, so almost three times more people cycled to their office. The rail and metro also went up from 14 per cent to 22 per cent and became the second most used transport in 2023.
Thirdly, the bus went down a little from 18 per cent to 15 per cent, and walking increased from 10 per cent to 12 per cent. These two changes was not very big if we compare them with the others.
In conclusion, the people of this city use their cars less than before and they prefer bicycles and trains now.
Why this is band 6: All the main figures are reported and the overview is adequate, but the answer works mechanically through one mode at a time and misuses 'per cent' for percentage points. Errors are frequent ('the way how', 'in the both years', 'These two changes was') though they rarely prevent understanding.
Показать образец на band 7
Band 7 model answer — 216 words
The grouped bar chart compares the means of transport used by commuters in a European city in 2005 and 2023, with each figure expressed as a percentage of all journeys to work.
Overall, there was a clear shift away from the private car towards cycling and rail travel, although driving remained the single most common option in both years.
The most dramatic change concerned car use, which fell from 52% of commuter journeys to 34% — a drop of 18 percentage points. Even after this decline, however, the car was still used by a third of commuters and no other mode came close to it.
Cycling grew fastest in relative terms, nearly tripling from a marginal 6% to 17%, which took it from the least used mode to the third most used. Rail and metro travel also made substantial gains, rising from 14% to 22%, and by 2023 it had overtaken the bus to become the second most popular choice.
The two remaining modes barely moved by comparison. Bus use declined modestly from 18% to 15%, making it the only form of public transport to lose share, while walking edged up from 10% to 12%. Taken together, the alternatives to the car accounted for just under half of journeys in 2005 and two thirds by 2023.
Why this is band 7: A clear overview, accurate data and well-sequenced paragraphs that group the largest changes first. Lexical control is good ('edged up', 'in relative terms', 'lose share'), but there is occasional slippage in complex structures, such as the agreement error in 'rail and metro travel ... by 2023 it had overtaken the bus'.
Показать образец на band 8
Band 8 model answer — 237 words
The chart compares the modes of transport used by commuters in one European city in 2005 and 2023, each shown as a percentage of all journeys to work.
Over the eighteen years the city's commuting pattern tilted decisively away from the private car: the four alternatives to driving together carried just under half of all commuters in 2005 but two thirds by 2023. The car nevertheless remained the single most used mode on both occasions.
Car use was responsible for almost the whole of this shift. Having accounted for 52% of journeys in 2005, it fell by 18 percentage points to 34% — still comfortably ahead of anything else, but no longer the choice of the majority.
Two modes absorbed most of the lost share. Rail and metro travel climbed from 14% to 22%, displacing the bus as the leading form of public transport, while cycling grew most sharply in proportional terms, rising almost threefold from a negligible 6% to 17% and moving from last place to third.
Changes at the margins were slight. The bus lost three points, to 15%, making it the only alternative to the car that did not benefit from the shift, and walking crept up from 10% to 12%. By 2023, therefore, commuting was spread far more evenly across the five modes than it had been at the start, when a single mode accounted for more journeys than the other four combined.
Why this is band 8: The overview captures the aggregate shift rather than restating individual bars, and the final sentence makes a comparison the data supports but does not state outright. Lexis is precise and varied ('absorbed most of the lost share', 'negligible', 'displacing'), with no errors of any kind.
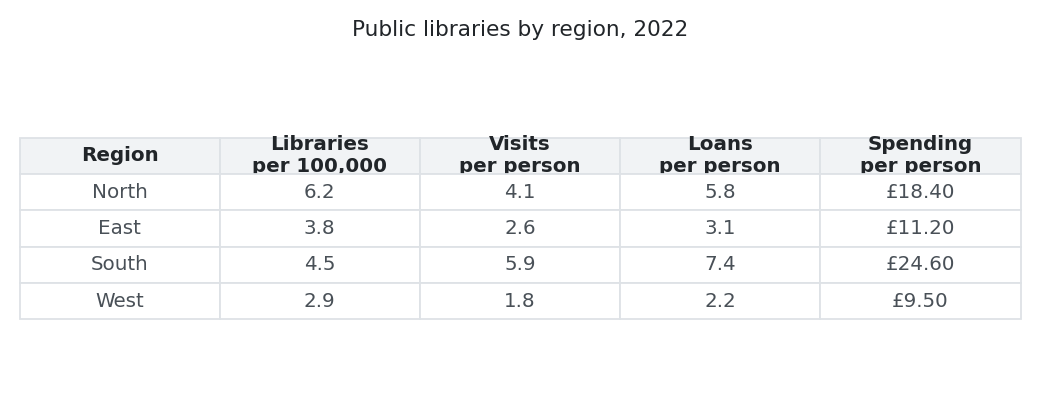
Task 1, вопрос 6: The table below gives information about public library provision and use in four regions of one country in 2022.
Summarise the information by selecting and reporting the main features, and make comparisons where relevant.
Показать образец на band 6
Band 6 model answer — 236 words
The table shows information about the public libraries in four regions of one country in the year 2022. It gives four different types of data, for example how many libraries there are for every 100,000 people and how much money is spended on each person.
Overall, it is clear that the South region has the best results in the most of the categories, and the West region has the worst results in all of them.
Firstly, the North has the biggest number of libraries with 6.2 per 100,000 people, but the people there do not use them so much as in the South. They visit 4.1 times in a year and borrow 5.8 books, and the spending is £18.40 per person.
Secondly, the South only has 4.5 libraries per 100,000 people, which is less than the North. However, the visits are 5.9 per person and the loans are 7.4 per person, so these are the highest figures of the table. The spending in the South is also the highest with £24.60.
Thirdly, the East and the West are both low. In the East there are 3.8 libraries, 2.6 visits, 3.1 loans and £11.20 of spending, and in the West all the numbers are the lowest ones: 2.9 libraries, 1.8 visits, 2.2 loans and only £9.50. This is approximately a half of the spending in the North.
In conclusion, more libraries does not always mean more readers.
Why this is band 6: The task is addressed and the key contrast between the North and the South is noticed, but the third body paragraph lapses into listing every figure without comparison, and the last paragraph is a single undeveloped line. Errors are frequent and noticeable ('is spended', 'in the most of', 'not so much as', 'more libraries does not'), though meaning is clear.
Показать образец на band 7
Band 7 model answer — 231 words
The table sets out four measures of public library provision and use in the North, East, South and West of one country in 2022.
Overall, the region with the most libraries was not the region whose residents used them most, and spending followed use rather than the number of buildings. The South performed strongest on every measure of use, while the West came last on all four indicators.
The North had by far the densest network, with 6.2 libraries per 100,000 inhabitants, more than twice the figure for the West and well ahead of the East on 3.8. Despite this, its residents made only 4.1 visits each during the year, well behind the 5.9 recorded in the South, where there were just 4.5 libraries for the same population.
Borrowing shows the same pattern more sharply. Southern residents took out 7.4 items per person, a figure which was more than three times the 2.2 loans recorded in the West and comfortably ahead of the North on 5.8. Spending was closely aligned with these figures: the South invested £24.60 per head, the North £18.40, the East £11.20 and the West only £9.50, which is less than 40% of the southern total.
The East and the West were consistently weak, with between 1.8 and 2.6 visits and no more than 3.1 loans per person, suggesting that a thin network and low funding go together.
Why this is band 7: A well-judged overview that identifies the mismatch between provision and use, and cohesion is managed without obvious signposting; some less common vocabulary ('densest network', 'closely aligned', 'indicators') is used accurately. What holds it at 7 is selection rather than accuracy: the spending paragraph recites all four figures instead of choosing between them, and the answer describes the table without drawing out any comparison the table only implies.
Показать образец на band 8
Band 8 model answer — 239 words
The table sets out four indicators of public library provision and use across the North, East, South and West of a single country in 2022.
Two features stand out. Provision and use do not match: the North maintained much the densest network yet its residents borrowed and visited less than those in the South, which had over a quarter fewer libraries per head. Funding, by contrast, tracked use closely, and on every measure of use the ranking ran South, North, East, West.
The contrast between the two leading regions is the sharpest in the table. The North offered 6.2 libraries per 100,000 people against the South's 4.5, but recorded 4.1 visits and 5.8 loans per person, compared with 5.9 and 7.4 respectively in the South. Interestingly, northern readers borrowed about 1.4 items for every visit, the highest rate in the table, so their libraries were used less often but more intensively.
Spending reinforces the pattern. The South committed £24.60 per head, a third more than the North's £18.40, while the two weaker regions were funded at a fraction of that level — £11.20 in the East and £9.50 in the West.
The West trailed on all four indicators, with fewer than three libraries per 100,000 residents, 1.8 visits and 2.2 loans per person. Taken with the East, which fared only slightly better, this suggests that sparse provision and low funding reinforce one another rather than compensating for each other.
Why this is band 8: Fully and selectively reported, with an overview that names the mismatch between provision and use and a derived comparison (loans per visit) that the table only implies. Cohesion is unobtrusive, lexis is precise and flexible ('tracked use closely', 'intensively', 'sparse provision'), and accuracy is sustained throughout.
Task 2 – эссе
40 мин · 250 словTask 2 весит вдвое больше, чем Task 1, поэтому ему и нужно отдать большую часть часа — около 40 минут и не меньше 250 слов. Самая частая причина, по которой сильный автор получает 6.5 вместо 7.5, — ответ лишь на часть вопроса, так что первые две минуты потратьте на то, чтобы точно понять, что именно вас просят сделать.
Разбор Task 2Как ответить на все части вопросаTask 2, вопрос 1
In cities and towns all over the world the high volume of traffic is a problem. What are the causes of this and what actions can be taken to solve this problem?
Показать образец на band 8
Band 8 model answer — 301 words
It is undoubtedly the case that urban areas around the world increasingly suffer from congestion. In this essay, I examine the reasons for this trend and suggest some practical policies the authorities could implement to reduce the level of traffic in our cities. The first step is to understand why traffic has increased in towns and cities. Broadly speaking, there are three main reasons for this. One is that cars have become more affordable for the average consumer and they are no longer a luxury item, but something that most families expect to own. A second reason is that public transport has become increasingly unreliable in recent years, not least because many bus and train services have been reduced because of the difficulty in funding them. The third reason is that society has in general become more mobile and this means more people are prepared to commute to work by car than they were before. There is almost certainly no one solution to this problem given the complexity of its causes. However, one option has to be to improve the reliability of public transport to encourage people to take the bus or the train rather than get in the car. It would also be possible to discourage people from driving to work by introducing special tariffs for using the roads, especially during peak periods. A successful example of this is the congestion charge scheme in London which has certainly reduced the level of trafficin inner-city areas. In conclusion, there are a variety of different factors that have led to rising levels of traffic in urban areas. While it may not be possible to find a complete solution, any action should probably involve encouraging greater use of public transport and making it more expensive for the motorist to drive in urban areas.
Task 2, вопрос 2
Some people think that the teenage years are the happiest times of most people's lives. Others think that adult life brings more happiness, in spite of greater responsibilities. Discuss both views and give your own opinion.
Показать образец на band 8
Band 8 model answer — 300 words
What's the happiest time in people's lives: youth or old age; school, career or retirement? All of these have been suggested, but teenage years and adulthood both have many supporters. Those who believe teenagers are the happiest people cite their lack of responsibilities as a significant factor. They are supported financially and emotionally by their parents, and although they may be included in family decisions, they're not ultimately responsible. However, adolescents are on the threshold of adult life: they're old enough to get a part-time job, so they can enjoy their first taste of financial independence, and their future study and career lie ahead. Away from these serious concerns, young people have an active social life with their friends, often simply by hanging out with them. And of course, there’s the excitement of first love and first heartbreak. With all this to experience, teenagers see their parents' lives as boring and stressful. However, the reverse is also true. Adults see anxious, self-dramatising adolescents, and appreciate the joys of maturity. These may include a contented family life, long-lasting friendships and a career. Long-term relationships may not have the fireworks of adolescence, but are stronger for it, because of the wealth of shared experience. At work, many of us are challenged and stimulated by the increasing, professional skills we acquire, which ensures that our jobs remain interesting. The greatest benefit, though, is that maturity gives you greater confidence in your own judgement, in all areas of life. You’re not afraid to express your opinion when others disagree and, unlike a teenager, you know when to let things go. Both these periods can be happy times, but I look back at my own teenage years, with no desire to go back. Adult life may be less dramatic, but fireworks don’t keep you warm
Task 2, вопрос 3
Many feel that the common educational system of teachers and students in a classroom will be replaced by the year 2050. Do you agree with this view? Give your opinion.
Task 2, вопрос 4
Some people believe that the main purpose of a university education is to prepare students for employment. To what extent do you agree or disagree? Give reasons for your answer and include any relevant examples from your own knowledge or experience. Write at least 250 words.
Показать образец на band 6
Band 6 model answer — 305 words
Nowadays a lot of people think that the main reason to go to the university is to find a good job after the graduation. I partly agree with this idea, but I think universities have also other important purposes.
Firstly, it is true that most of the students study because they want a career. University is very expensive in many countries, so the families expect some return for their money. For example, a student who studies medicine or engineering will have the practical skills which the employers are looking for, and these degrees usually lead to a well paid job. If universities don't prepare the young people for the labour market, the unemployment will become a serious problem for the society.
Secondly, employers today complain that the graduates cannot work in a team or write a report properly. This shows that universities should teach more practical things like communication and computer skills, not only the theory from the books. In my country many universities now have an obligatory work placement in the third year and I think this is a very good development.
On the other hand, the university is not only a training centre for the companies. Students also learn how to think in a critical way and how to do their own research, and these abilities are useful in all the areas of life, not only at work. Moreover, some subjects like history or philosophy do not have a clear job at the end, but they are still important for the culture of a country. If we close these departments, we will lose something valuable.
In conclusion, I agree that preparing students for the employment is one of the main purposes of the university, but it should not be the only one, because education also makes better citizens and not only better workers.
Why this is band 6: Task Response is adequate: a position is given and both sides are mentioned, but the second paragraph drifts into employers' complaints rather than developing the writer's own argument. Cohesion is mechanical ('Firstly', 'Secondly', 'In conclusion') and errors in articles and collocation ('the unemployment', 'a clear job at the end') are noticeable throughout without blocking meaning.
Показать образец на band 7
Band 7 model answer — 283 words
It is often argued that universities exist primarily to equip students for the job market. While employability clearly matters, I believe this view defines higher education too narrowly, and that preparing graduates for work is only one of its purposes.
There are strong reasons for taking the employment argument seriously. Degrees now represent a substantial financial commitment, and students who borrow heavily are entitled to expect that their qualification will improve their prospects. Vocational courses such as nursing, architecture and accountancy are explicitly designed with this in mind, and the professional accreditation attached to them is precisely what makes them valuable. A government that funds universities out of taxation also has a legitimate interest in a skilled workforce, since skills shortages slow economic growth.
However, treating employability as the main purpose of a degree overlooks what universities are uniquely able to do. A graduate who has spent three years evaluating evidence, constructing an argument and defending it under criticism acquires habits of mind that outlast any particular job. This matters more than it used to, because technological change means that many specific skills learned at twenty will be obsolete by forty, while the capacity to learn something new will not.
There is also a wider social case. Research in subjects with no obvious commercial application — ancient languages, pure mathematics, archaeology — has repeatedly proved valuable in ways nobody anticipated, and a society that funds only what pays immediately will eventually run short of ideas.
In my view, then, employability is a reasonable expectation rather than the central aim. Universities serve their students best by developing judgement and intellectual independence, qualities which happen to be exactly what thoughtful employers say they value most.
Why this is band 7: A clear position is stated and maintained, with logical progression and well-chosen support; some less common lexis ('professional accreditation', 'habits of mind', 'skills shortages') is used accurately. Development of the social argument is thinner than the rest — the paragraph on subjects with no commercial application makes its claim in two sentences and never illustrates it — and the conclusion rests on an assertion about what employers value that the essay nowhere supports, which keeps it from band 8.
Показать образец на band 8
Band 8 model answer — 337 words
Universities are increasingly judged by the salaries of their graduates, and it is now common to hear that preparing students for work is what higher education is fundamentally for. I would accept that employability is one legitimate purpose, but I disagree that it is the main one, because the most useful thing a degree gives a student is not a set of occupational skills at all.
The case for the employment view is not trivial. Tuition fees and student debt have turned a degree into an investment, and students who are paying for one are entitled to ask what it buys. Professional courses answer that question directly: a pharmacy or civil engineering degree is built around the competences the profession requires, and it would be absurd to design such a course without reference to the work graduates will do. Governments funding universities from taxation can reasonably expect the same responsiveness.
The difficulty is that occupational preparation is the part of a degree that ages fastest. The particular software, regulations and techniques a student masters at twenty-one are routinely obsolete a decade later, whereas the ability to read a difficult argument closely, weigh evidence against it and change one's mind in public does not expire. Employers themselves make this point: surveys of graduate recruiters consistently rank reasoning, writing and collaboration above technical knowledge, which is a curious outcome if universities are best understood as training providers.
A narrow focus on employment also distorts what is studied. Subjects whose economic value is impossible to forecast — epidemiology before a pandemic, number theory before encryption — look like luxuries until they suddenly do not, and a country that funds only immediately marketable research is choosing to be surprised.
My own position is therefore one of qualified disagreement. A university that ignored the job market would be failing its students, but one that organised itself around it would be failing them more comprehensively, by teaching them what the economy wants this decade instead of how to think for the next four.
Why this is band 8: A fully developed and consistently nuanced response: the concession is argued as seriously as the writer's own case, and the recruiter evidence is used to turn the opposing argument rather than merely rebut it. Cohesion is achieved through the logic of the paragraphs rather than connectives, and lexis is precise and flexible ('qualified disagreement', 'responsiveness', 'immediately marketable').
Task 2, вопрос 5
Some people think that employers should allow their staff to work from home whenever they wish. Others believe that regular attendance at a workplace is essential for an organisation to function well. Discuss both views and give your own opinion. Give reasons for your answer and include any relevant examples from your own knowledge or experience. Write at least 250 words.
Показать образец на band 6
Band 6 model answer — 307 words
These days many companies let their employees to work from their homes, and some people say this should be a free choice for everybody. Other people disagree and think the workers must come to the office regularly. In this essay I will discuss the both opinions and give my own view.
Firstly, there are many advantages of working from home. The most obvious one is the time. In big cities the people often spend two hours every day in the traffic, and if they stay at home they can use this time for the family or for the rest. Also the parents with small children can organise their day in a more flexible way, so they don't need to leave their job. Another advantage is that the company can save money on the offices and the employees are usually more happy, so they don't change the job so often.
Secondly, the other opinion also has some good points. Some tasks are very difficult to do by a video call, for example training a new colleague or solving a complicated problem together. When everybody is at home, the young workers cannot learn from the experienced ones because they don't see how they work. The managers also say that the team spirit becomes weaker and the people feel alone, which is bad for the mental health.
In my opinion, the best solution is in the middle. The companies should not force the staff to come every day, but a total freedom is also not a good idea. I think two or three days in the office is enough, because in this way the employees have the flexibility and the team can still meet face to face and keep the good relations.
In conclusion, the both views are reasonable, but a mixed system is better than the two extreme options.
Why this is band 6: Both views are addressed and an opinion is given, but the second view receives less development than the first and the conclusion repeats what has already been said. Linking is mechanical and overt, and errors with articles and verb patterns ('let their employees to work', 'the both opinions', 'more happy') are noticeable in every paragraph.
Показать образец на band 7
Band 7 model answer — 312 words
Remote working has moved from an occasional privilege to a standing expectation, and opinion is divided over whether staff should be free to choose it. Some argue the decision belongs entirely to the employee, while others insist that an organisation only works properly when people are physically present. My own view is that neither extreme is defensible.
The argument for unrestricted home working rests largely on evidence that it suits both sides. Employees reclaim the commute, which in large cities can amount to ten hours a week, and gain the flexibility to manage childcare or medical appointments without taking leave. Employers benefit too: smaller premises cost less, and firms that recruit remotely can hire from a far wider pool. For work that is measured by output rather than hours — writing code, drafting contracts, analysing data — it is hard to see what attendance adds.
The opposing case is strongest where work is genuinely collective. Training is the clearest example: a new recruit learns a great deal by overhearing how a senior colleague handles a difficult client, and almost none of that survives a scheduled video call. Problem-solving tends to happen in unplanned conversations, and informal contact is also what holds a team together, which is why isolation and disengagement are reported more often by staff who work entirely from home.
I believe the mistake is treating this as a matter of principle rather than of task. Work that requires concentration is usually done better at home, while work that depends on supervision, negotiation or induction is done better in person. A policy of two or three collective days a week, with the rest left to the individual, captures most of the benefits of each arrangement.
In short, employers should neither insist on daily attendance nor surrender the decision completely, but match the place of work to the nature of the work.
Why this is band 7: Both positions are developed and a clear opinion runs through the answer, with effective paragraphing and some strong collocation ('standing expectation', 'reclaim the commute', 'induction'). The concluding paragraph adds little beyond the previous one, and the occasional long sentence loses control, so it sits at 7 rather than 8.
Показать образец на band 8
Band 8 model answer — 373 words
Few workplace questions have changed as quickly as this one. What was an exceptional arrangement a decade ago is now a condition many candidates negotiate before accepting a post, and employers are correspondingly split between those who would leave the choice entirely to staff and those who regard regular attendance as non-negotiable. I find both positions too absolute, because each assumes that all work is of the same kind.
Those who favour unrestricted home working can point to real gains. A commute of an hour each way consumes roughly ten working hours a week, and returning that time to employees is the cheapest benefit an employer can offer. Flexibility also keeps people in work who might otherwise leave it — parents of young children, carers, those managing a chronic condition — and widens recruitment well beyond travelling distance of an office. Where performance can be judged by what is produced, attendance is a proxy for effort that nobody needs any more.
The case for the workplace is weaker on productivity but much stronger on everything that is learned rather than produced. A trainee solicitor picks up judgement by watching how a partner handles an awkward negotiation, and that kind of apprenticeship transfers poorly to a scheduled call. The same applies to the half-formed suggestion made in a corridor, to the correction a colleague offers before a mistake is made, and to the ordinary familiarity that makes disagreement survivable within a team. Organisations that went fully remote have tended to discover these costs late, in weaker induction and higher turnover among their newest staff.
What follows, in my view, is that the question has been framed wrongly. The variable is not the employee's preference or the employer's authority but the task: concentrated individual work belongs at home, while supervision, induction and anything requiring negotiated agreement belongs in a room. A settlement in which teams share two or three fixed days and the individual decides the rest respects both the evidence and the fact that organisations are not simply collections of separate jobs.
Allowing staff to work wherever they wish is thus a reasonable default rather than an absolute right, and it works only where someone has thought about what the office is still for.
Why this is band 8: Both views are fully and even-handedly developed, and the writer's position reframes the question rather than splitting the difference. Cohesion is well judged and largely implicit, lexis is precise and idiomatic ('a proxy for effort', 'apprenticeship', 'reasonable default'), and the few complex structures are handled without error.
Task 2, вопрос 6
In many countries a large proportion of the food that is produced is thrown away rather than eaten. What are the causes of this problem, and what measures could be taken to reduce the amount of food that is wasted? Give reasons for your answer and include any relevant examples from your own knowledge or experience. Write at least 250 words.
Показать образец на band 6
Band 6 model answer — 313 words
It is a fact that a big quantity of the food which the farmers produce never arrives on the table and it is thrown to the rubbish. In this essay I will explain the main causes of this problem and suggest some solutions.
Firstly, one important cause is the behaviour of the consumers. In the rich countries food is cheap in comparison with the salaries, so the people buy more than they need, especially in the big supermarkets where there are a lot of special offers like 'two for one'. After some days the products in the fridge become old and the families throw them away without thinking. Many people also don't understand the labels and they believe that the food is dangerous after the 'best before' date, which is not always true.
Secondly, another cause is the supermarkets themselves. They only accept the vegetables and the fruits with a perfect form and colour, so the farmers must destroy a part of their harvest even if it is completely good to eat. In the poorer countries the reason is different, because there the food is lost before the market because of the bad roads and the lack of the refrigeration.
There are some measures which can reduce this situation. The governments should start campaigns in the schools and on the television to teach the families how to plan their shopping and how to use the leftovers. Also the supermarkets could be obliged by law to give their unsold products to the charities instead of putting them in the bin, like they do in some European countries. Finally, the farmers in the developing world need a better transport and more cold storage.
In conclusion, the food waste happens because of the habits of the consumers and the rules of the shops, and only a combination of the education and the legislation can solve it.
Why this is band 6: Both parts of the task are covered, though the solutions are listed rather than explained and the final suggestion is left undeveloped. Linking is overt and repetitive, and persistent errors with articles ('the food waste', 'a better transport') and collocation ('thrown to the rubbish') mark the answer as band 6, despite consistently clear meaning.
Показать образец на band 7
Band 7 model answer — 297 words
Roughly a third of the food grown worldwide is never eaten, which is remarkable given how much land, water and labour goes into producing it. The causes lie in both consumer habits and the way supply chains are organised, and reducing the waste will require action at several points.
In wealthier countries, the fundamental cause is that food is cheap relative to income. When a bag of salad costs a few minutes' wages, throwing it away carries no real penalty, and promotions that reward bulk buying encourage households to purchase more than they can realistically eat. Confusion over date labels makes matters worse: many shoppers treat 'best before', which indicates quality, as though it were a safety deadline, and discard food that is perfectly edible.
Retailers contribute in a less visible way. Cosmetic standards for fresh produce mean that misshapen but entirely usable crops are rejected at the farm gate, while rigid ordering practices leave growers with surpluses they cannot sell. In lower-income countries the losses occur earlier still, before food reaches any shop, because poor roads and the absence of cold storage allow harvests to spoil in transit.
Several measures would help. Standardising and simplifying date labels is cheap and has already cut household waste where it has been tried. Supermarkets can be required, as they now are in parts of Europe, to offer unsold stock to charities rather than send it to landfill, and relaxing cosmetic specifications would allow more of each harvest to be sold. Investment in rural refrigeration and transport is the single most effective intervention in developing economies.
None of these alone is sufficient, but together they address waste where it actually occurs, which is in the home, in the shop and on the road rather than in any one of them.
Why this is band 7: Both the causes and the measures are addressed clearly and the argument progresses logically from household to retailer to supply chain, with accurate use of less common vocabulary ('cosmetic standards', 'at the farm gate', 'spoil in transit'). The solutions paragraph covers four measures rather briefly, and there is minor clumsiness in the longer sentences.
Показать образец на band 8
Band 8 model answer — 370 words
Something close to a third of the world's food is produced and then discarded, which means that a corresponding share of the land, water and fuel used to grow it is wasted as well. The reasons differ sharply between rich and poor countries, and so, consequently, do the remedies that would work.
In high-income countries the decisive factor is price. Food absorbs a far smaller share of household income than it did two generations ago, so the cost of throwing a meal away is trivial, and nothing in a weekly shop makes that cost visible. Retail practice compounds the problem: multi-buy offers push households to buy in quantities they cannot consume, and date labels are widely misread, with 'best before' treated as a safety limit when it refers only to quality. Supermarkets add waste upstream too, rejecting produce on appearance and placing orders that leave growers with crops they have no second market for.
Where incomes are lower the losses happen long before anyone decides what to cook. Harvests sit in the heat because there is no cold chain, and journeys that should take hours take days on unsurfaced roads, so a substantial proportion of what is grown spoils between the field and the nearest town. Waste here is a failure of infrastructure rather than of attitude, and campaigns urging consumers to be careful would miss the point entirely.
Effective measures therefore have to be matched to the cause. The cheapest intervention in developed economies is regulatory: a single clear labelling standard, restrictions on promotions that reward over-purchase, and a legal duty on large retailers to offer edible surplus to redistribution charities before disposal, as several European countries now impose. Relaxing cosmetic specifications would return a further share of each harvest to the market. In poorer countries the priority is capital — solar-powered cold rooms at collection points, better rural roads, and storage that keeps grain dry — none of which is glamorous, but all of which saves food that has already been grown.
The common thread is that waste is cheapest to prevent closest to where it happens. Policy aimed at the household in one country and at the road in another is not inconsistency; it is simply accurate.
Why this is band 8: Fully developed, with a clear organising principle — rich and poor economies analysed separately and each measure matched to the cause it addresses — and cohesion that comes from that structure rather than from connectives. Lexis is precise and flexible ('cold chain', 'upstream', 'redistribution charities', 'unsurfaced roads') and accuracy is maintained across consistently complex sentences.
Предложение ограничено
20+ пробных тестов IELTS с оценкой и разбором ошибок.